2018 General Findings Report

Download the Full Report
Download the Key Findings
The LGBTQ Institute Southern Survey: Filling a Critical Research Gap Regarding the Lives of LGBTQ Southerners
The purpose of this study is to document and examine the contemporary life circumstances and social experiences of Lesbian, Gay, Bisexual, Transgender, and Queer (LGBTQ) people living across the American South. Our primary research aim is to improve public and scientific understanding LGBTQ Southerners' educational and employment status, access to healthcare, community and political involvement, and experiences of sexuality and/or gender-related discrimination.
The data was collected using an untraceable, online, anonymous survey of self-identified LGBTQ adults living in 14 US states, including: Alabama, Arkansas, Florida, Georgia, Kentucky, Louisiana, Mississippi, North Carolina, Oklahoma, South Carolina, Tennessee, Texas, Virginia, and West Virginia. In addition to analyzing the survey data, we also plan to compare the survey results with corresponding publicly available national and state-level data from the U.S. Census Bureau and other national surveys.
The results of this study will be used to help raise awareness and contribute new scientific knowledge about the experiences and needs of LGBTQ people in the South. We also believe that LGBTQ community organizations, state and local government will find the results of this study useful in planning services, initiatives, and programming for this vulnerable minority population.
Our initial focus will be preparing a series of public reports about the life of the LGBTQ people living in the South as a region and in each of the 14 focal states. These reports, research briefs, and key findings fact sheets will be made publicly available on this website. In addition, we plan to use the data to develop manuscripts for publication in scientific literature.
Key Findings
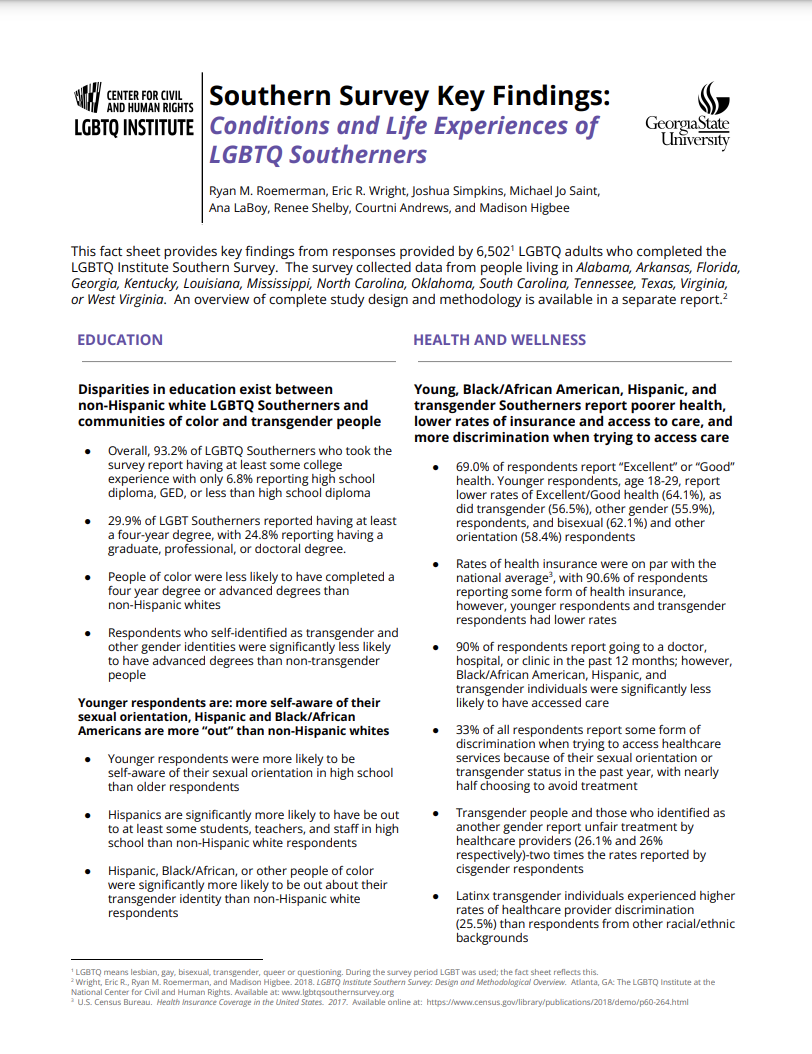
Key findings from responses provided by 6,502 LGBTQ adults who completed the LGBTQ Institute Southern Survey living in Alabama, Arkansas, Florida, Georgia, Kentucky, Louisiana, Mississippi, North Carolina, Oklahoma, South Carolina, Tennessee, Texas, Virginia, or West Virginia. Overall study design and methodology is available in the full study protocol. Note: during the survey period LGBT was used; our key findings reflect this. Download all the Key Findings by clicking the link above.
Suggested Citation: Wright, Eric R., Joshua Simpkins, Michael Jo Saint, Ana LaBoy, Renee Shelby, Courtni Andrews, Madison Higbee, and Ryan M. Roemerman. 2018. State of the South: A Snapshot on the Conditions and Life Experiences of LGBTQ Southerners. Atlanta, GA: The LGBTQ Institute at the National Center for Civil and Human Rights.
EDUCATION
Disparities in education exist between non-Hispanic white LGBTQ Southerners and communities of color and transgender people
Overall, 93.2% of LGBTQ Southerners who took the survey report having at least some college experience with only 6.8% reporting high school diploma, GED, or less than high school diploma
29.9% of LGBT Southerners reported having at least a four-year degree, with 24.8% reporting having a graduate, professional, or doctoral degree.
People of color were less likely to have completed a four year degree or advanced degrees than non-Hispanic whites
Respondents who self-identified as transgender and other gender identities were significantly less likely to have advanced degrees than non-transgender people
Younger respondents are more self-aware of their sexual orientation, Hispanic and Black/African Americans are more “out” than non-Hispanic whites
Younger respondents were more likely to be self-aware of their sexual orientation in high school than older respondents
Hispanics are significantly more likely to have be out to at least some students, teachers, and staff in high school than non-Hispanic white respondents
Hispanic, Black/African, or other people of color were significantly more likely to be out about their transgender identity than non-Hispanic white respondents
HEALTH AND WELLNESS
Young, Black/African American, Hispanic, and transgender Southerners report poorer health, lower rates of insurance and access to care, and more discrimination when trying to access care
69.0% of respondents report “Excellent” or “Good” health. Younger respondents, age 18-29, report lower rates of Excellent/Good health (64.1%), as did transgender (56.5%), other gender (55.9%), respondents, and bisexual (62.1%) and other orientation (58.4%) respondents
Rates of health insurance were on par with the national average*, with 90.6% of respondents reporting some form of health insurance, however, younger respondents and transgender respondents had lower rates
90% of respondents report going to a doctor, hospital, or clinic in the past 12 months; however, Black/African American, Hispanic, and transgender individuals were significantly less likely to have accessed care
33% of all respondents report some form of discrimination when trying to access healthcare services because of their sexual orientation or transgender status in the past year, with nearly half choosing to avoid treatment
Transgender and those who identified as another gender report unfair treatment by healthcare providers (26.1% and 26% respectively)-two times the rates reported by cisgender respondents
Latinx transgender individuals experienced higher rates of healthcare provider discrimination (25.5%) than respondents from other racial/ethnic backgrounds
*U.S. Census Bureau. Health Insurance Coverage in the United States. 2017. Available online at: https://www.census.gov/library/publications/2018/demo/p60-264.html
EMPLOYMENT
Transgender people less likely to report working full-time and more likely to report experiencing workplace discrimination
54.0% of respondents report working full time and 7.8% report working part-time. An additional 11.3% stated that they work two or more jobs; 9.7% report going to school full-time, and 7.4% are retired
Transgender and other gender identified individuals are less likely to work full-time than people who identify as cisgender
Transgender Southerners are significantly more likely to report being treated unfairly by an employer in hiring, pay, or promotion than their LGB peers (14.4% vs. 5.4%)
Bisexual and another sexual identity respondents were somewhat less likely to report working full-time and more likely to report working part-time or having two or more employment statuses
POLITICAL AND COMMUNITY INVOLVEMENT
LGBT Southerners are active in politics...
93% of respondents were registered to vote
90% voted in the 2016 election
58.9% identified as Democrat, with 82.2% identifying as liberal or very liberal
96.5% reported dissatisfaction with the Trump Administration
...and their communities
75.9% of respondents believe that equal employment should be the top priority of community advocates and political leaders
56.4% of respondents attended pride
49.4% attended LGBT marches
34.1% are members of a state or national (30.3%) LGBTQ advocacy organization
EXPERIENCES OF DISCRIMINATION
The most common forms of discrimination on the basis of sexual orientation or transgender status in the past year:

Summary of past year and lifetime prevalence of different types of discrimination based on sexual orientation and being transgender:

Additional key findings regarding experiences of discrimination:
Respondents in the 40-49 and 50-59 age groups report the highest lifetime rates of discriminatory experiences
Black/African American transgender respondents were most likely to report feeling unwelcome in places of worship (37.1%)
Significantly greater rates of Black/African American LGB respondents (77.3%) report having been threatened or physically attacked in their lifetime because of their sexual orientation when compared with LGB respondents in other racial/ethnic groups
Latinx transgender individuals experienced being threatened or physically attacked the most at 29.1% because of their transgender identity when compared with transgender respondents in other racial/ethnic groups